-

-

-
 PT | EN
PT | EN 
6a0c6f1f940cf.jpg)
This is the first text in a series of analyses to be published periodically by CEBRI, focused on the performance of the trade balance, with emphasis on the responses of Brazilian foreign trade to the profound–and still unpredictable–transformations underway in the international scenario, whether as a consequence of the increasingly protectionist environment–which has given new urgency to the negotiation of bilateral agreements between countries and/or economic blocs–or due to the need to rethink the way Brazil positions itself into the global reordering that production chains are undergoing. In this uncertain context–which simultaneously points to risks and opportunities–the need for an expansion and diversification of Brazilian foreign trade stands out imperatively, not only in its role as an “engine of growth”; but also as an instrument for reducing vulnerabilities present in its economy, and which the new international context has been accentuating: CEBRI´s analyses, which will be quarterly, intend to give special attention to this diversification effort, both in the import and export axes, with particular attention to countries and sectors in which this dynamic will be operating. [1]
In a year marked by profound transformations in the rules of international trade–notably the implementation of new tariff barriers that significantly affected Brazilian exports to the USA (a drop of 2,6 U$ Billion)–the figures relating to Brazilian Foreign Trade in 2025 point to positive results (table 1): a growth of 4.8% in the trade flow (US$ 629.06 billion) resulting from a growth of 3.5% in exports (US$ 348.68 billion)–at a rate higher than the growth of world exports (2.4%) in 2025 [2] –and 6.6% in imports (US$ 280.38 billion).
The trade surplus of US$68.3 billion, 8% lower than in 2024 (-US$5.9 billion), reflects less the reduction in exports to the US (-US$2.6 billion) than a significant jump in imports (+US$18.5 billion, +6.7%), mainly capital goods and intermediate products, associated with a partial recovery of domestic economic activity.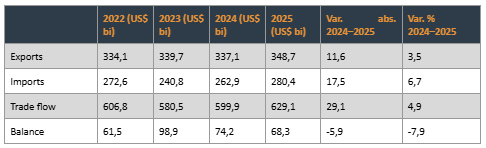
Table 1 – Brazilian Trade Balance 2022–2025 (in billions of US$). Source: Comex Stat (MDIC).
At first glance, these figures–which are positive in aggregate–would suggest that the country would have largely neutralized the effects of the new tariff barriers. However, a more detained analysis points to the fact that: (i) despite the efforts made to achieve a greater trade diversification, in 2025 they did not yield significant results in absolute terms, although, in relative terms, some significant successes emerged, such as the 30% increase with India and the 14% increase with Canada; (ii) the neutralization of the effect of the negative variation in exports to the US was less associated to a structural adaptation (for which there was little time) than to windfalls in some sectors which–individually–more than compensated for the reduction in foreign exchange revenue from the American market. These are (Table 2):
A. Main Export Items in 2025
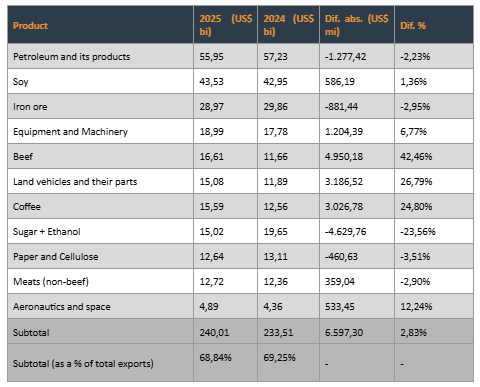
Table 2 – Main products exported in 2024 and 2025 (in billions of US$)—source: Comex Stat (MDIC) and Cecafé.
By examining Table 2, it shows that, in 2025, the main exported items were, on the one hand, mineral products (especially oil and iron ore) and, on the other hand, a diversified range of agricultural products–such as soybeans, corn, sugar, coffee, cotton, meat and forestry products, in which Brazil occupies a dominant position–consolidating the country´s position as the world´s largest net exporter of agricultural products and practically equaling the US as the world´s leading exporter (gross) (US$ 169 billion vs US$173 billion). [3]
In the manufacturing industry sector the main items were aeronautics, machinery equipment, motor vehicles, steel, paper and pulp, with a strong concentration in some markets (≈62% of aeronautics in the USA, ≈52% of motor vehicles in Argentina, ≈40% of paper and pulp in China) (table 3).
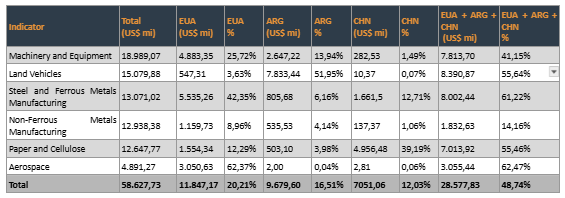
Table 3 – Main industrial products exported to the USA, Argentina (ARG) and China (CHN) (2025). Source: Comex Stat (MDIC).
While the record values achieved by the beef, coffee, and automotive sectors in 2025 allowed for a combined performance that far exceeded the revenue loss in the US market during 2025 (US$11 billion additional vs. a revenue reduction of US$2.6 billion), these favorable results, however, reflected contingent movements which are not necessarily recurrent.
B. Main Trade Flows in 2025
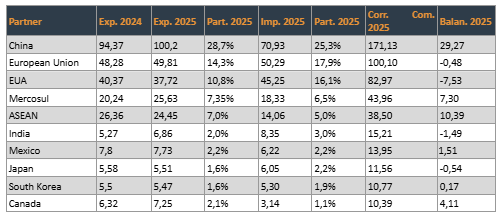
Table 4 – Main export destinations in 2024 and 2025 (in billions of US$). Source: Comex Stat (MDIC)
B.1. Brazil's main trade destinations in 2025 (Table 4) were: China, EU, USA, Mercosul and ASEAN, with significant growth observed in only two regions: China (mainly additional purchases of beef and soybeans) and Mercosur (mainly the surge in vehicle imports by Argentina);
B.2. It is noticeable how much the focus of Brazilian foreign trade has shifted towards Asia:
B.3. Regarding the US, the figures for 2025 are an “underestimate” of the extent of the negative impact of the new US tariffs, since their effects were concentrated in the last five months of the year and were introduced progressively (10% from April + 40% from August):
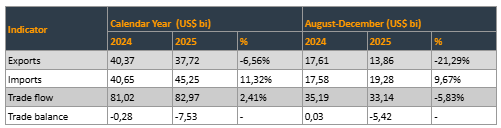
Table 5 – Brazil-US Trade Balance (2024-2025) (in billions of US$). Source: Comex Stat (MDIC).
As can be seen in Table 5, half of the reduction in revenue from Brazilian exports to the American market in 2025 is explained by the drop (21%) that occurred from August onwards, when the monthly average of US$ 3.4 billion observed between January and July (which pointed to an annual growth of 1%) fell to US$ 2.5 billion in the period August–November 2025.
If the next rounds of negotiations with the US produce no progress, the potential trade loss in 2026 (if measured from the last five months of the year) would be a multiple of the figure recorded in the 2025 statistics.
Therefore, in the face of an increasingly protectionist international environment, bilateral initiatives have gained a decisive importance–notably through the ongoing negotiations between Brazil, through Mercosur, with Singapore, Canada, and, especially, the European Union–but which should only produce effects in the medium and long term.
CONCLUSION
The figures for 2025 allow us to identify some of the “leading trends” in Brazilian current foreign trade:
1. Despite an adverse international scenario, Brazilian trade grew at a higher rate than the international market (trade of goods), once again consolidating its position as the world´s largest (net) exporter of agricultural products ;
2. However, some vulnerabilities can be identified which paradoxically are the reverse of “success stories” such as:
3. Given the possibility that: (a) the favorable conjunctural movements that resulted from a significant windfall in some sectors in 2025 will not be repeated in 2026; (b) and that–if there is no progress in the negotiations–the negative effects of American limitations may deepen, the need for an ambitious trade diversification strategy stands out: a) through bilateral negotiations, notably with markets with large populations and high economic dynamism, such as India and ASEAN countries, and economies, such as Canada and Mexico, for which trade diversification has also become a strategic priority; and b) through ongoing multilateral negotiations, noting that the recently signed Mercosur-EU Agreement acquires an unprecedented relevance (beyond its geopolitical significance), presenting an extraordinary potential for expanding and diversifying Brazil’s trade flows, even though its effects depend on its implementation process in the medium and long term.
Expanding Brazil´s participation in international trade–in addition to its positive contribution to economic development as an “engine of growth”–can therefore be directed towards a second purpose: that of reducing vulnerabilities, such as those mentioned above, through diversification of supply sources as well as the range of export destinations.
The very conspicuous gap between Brazil´s weight in the world economy (11th place) and its share of international trade (25th place)–reflected in the sector´s ≈15% share of GDP–suggests the existence of an ample potential for expansion.
*The authors would like to thank Augusto Castro, Lia Valls, Antonio de Souza e Silva, José Pimenta and the CEBRI team for their careful reading of the material and comments.
Notes
[1] The authors would like to thank José Ricardo Araujo (CEBRI) for his support in preparing this situational analysis.
[2] World Trade Organization. 2025. AI goods and frontloading lift world trade in 2025 but outlook dims for 2026. WTO. Published on October 7, 2025. https://www.wto.org/english/news_e/news25_e/stat_07oct25_e.htm.
[3] Source: United States Department of Agriculture, 2025.
References
Brasil. Ministério do Desenvolvimento, Indústria, Comércio e Serviços (MDIC). Comex Stat. Sistema oficial de estatísticas de comércio exterior. https://comexstat.mdic.gov.br/pt/home.
Cecafé. 2026. “Exportação de café do Brasil cai em 2025, mas receita é recorde.” Cecafé Notícias, January 19, 2026. https://www.cecafe.com.br/publicacoes/noticias/cecafe-exportacao-cafe-2025-20260119/
U.S. Department of Agriculture, Economic Research Service, and Foreign Agricultural Service. 2025. Outlook for U.S. Agricultural Trade: December 2025. AES-134. Washington, DC: U.S. Department of Agriculture, December 23, 2025. https://www.fas.usda.gov/sites/default/files/2025-12/AES-134.pdf.
World Trade Organization. 2025. AI goods and frontloading lift world trade in 2025 but outlook dims for 2026. WTO. Publicado em 7 de outubro de 2025. https://www.wto.org/english/news_e/news25_e/stat_07oct25_e.htm
Recebido: 19 de março de 2026
Aceito para publicação: xx de MÊS de 2026
Translation published: June 9, 2026
* Translated by Theo Pereira with the support of digital machine translation tools: Google Translate (initial draft), Grammarly (grammatical and syntactic revision), and ChatGPT (selective phrasing refinements). Reviewed by the author.
Copyright © 2026 CEBRI-Revista. Este é um artigo em acesso aberto distribuído nos termos da Licença de Atribuição Creative Commons, que permite o uso irrestrito, a distribuição e reprodução em qualquer meio, desde que o artigo original seja devidamente citado.
