-

-

-
 PT | EN
PT | EN 
This article describes how BRICS countries are faring in decarbonization, i.e., in the transition to a low-carbon economy. Scientific evidence of climate change and the need to reduce greenhouse gas emissions to mitigate extreme weather events and the rising global temperature that endanger life on Earth make this an ever more important agenda. The BRICS group does not operate as a consistent coalition in international climate politics. This article reviews the emissions profile, main emissions reduction policies and foreign policy positions of each BRICS country.
639b3dfc30117.jpg)
International negotiations to reduce the concentration of greenhouse gases (GHGs) in the atmosphere to mitigate the existential threat climate change poses to humankind have been in course since 1992. There has been no progress: the concentration continues to increase, reaching 415.78 parts per million in October 2022 (NOAA 2022). As a result, extreme weather events are increasingly frequent and intense. Scientists have warned that if the concentration exceeds 450 parts per million, the severity of the changes will profoundly impact life on Earth.
Brazil, Russia, India, China, and South Africa (BRICS) are major carbon emitters. The first four, along with the United States (U.S.), the European Union, the United Kingdom, Japan, Indonesia, and South Korea, are climate powers – countries that own a significant share of global emissions and have the human and technological capacity to pursue decarbonization. Any analysis of climate change mitigation efforts requires reviewing those countries' commitment to the climate agenda. Under the 2015 Paris Agreement, each country agreed to indicate its GHG reduction targets and, every few years, provide more ambitious targets from time to time. The analysis of climate commitment within this new model requires going beyond foreign policy analysis to understand the dynamics of each country's domestic politics.
Under the 2015 Paris Agreement, each country agreed to indicate its GHG reduction targets and provide more ambitious targets from time to time. The analysis of climate commitment within that new model requires going beyond foreign policy analysis to understand the dynamics of each country's domestic politics.
This paper contributes to the debate by reviewing the dynamics of decarbonization in the BRICS countries. The BRIC acronym was created in 2001 by an economist who predicted that global economic growth would be driven less by the growth of industrialized economies and more by emerging economies, four in particular: Brazil, Russia, India, and China. Those countries viewed that acronym favorably. In 2006, they initiated a high-level dialog in a parallel meeting to the one held annually by the United Nations General Assembly, and began to meet formally with the 2009 BRIC Summit. South Africa joined the group in 2011, and BRIC became BRICS.
The BRICS group is a forum of countries quite different from each other – in terms of military power, economic power, soft power – but that had a common agenda when the group was created: they wanted their increased significance in the global economy, stemming from their economic growth rates, to be followed by a reform of international institutions giving them greater influence in international politics. Much has happened in these countries and in the international arena in the twenty years since the group's formation: the international financial crisis, the rise of the authoritarian right, the aggravation of global problems such as climate change, the COVID-19 pandemic. Together with factors stemming from domestic politics, these changes affected the consistency of joint BRICS action. Four BRICS countries (Brazil, South Africa, India, and China) formed the BASIC coalition in the international climate regime. Russia did not join because of its peculiar positions and history, and is not usually aligned with joint BASIC positions. As a member of Annex I of the Climate Convention, Russia has had mandatory emissions reduction targets since the Kyoto Protocol. Climate denialism remains very strong in Russia.
The low carbon transition is a key aspect of the current global scene. It is much broader than negotiations within the international climate regime. The structural reduction in GHG emissions demands new production and consumption patterns and institutional and behavioral change. Progress is contingent on each country's emissions profile and economic, political and social architecture. Even if the BRICS coalition lacks consistency, its members continue to represent a category of countries that influence empirical reality. The BRICS countries are very different from each other, have different historical backgrounds, boast different but significant resources of power, and have influence on global governance. We chose to focus on BRICS countries in the global transition to a low-carbon economy not to defend or judge their operation as a coalition but to describe their progress in the low carbon transition from the perspectives both of their domestic politics and of their positions in the international climate regime.
This paper is divided into three parts: first, it describes each country's emissions profile; it then reviews their main policies and the political economy of decarbonization in major emissions-heavy sectors; finally, it analyzes the impact of three recent key international events on their decarbonization dynamics – heightened United States-China tension, which many analysts name Cold War 2.0; the COVID-19 pandemic; and the war in Ukraine. This paper explains why BRICS countries do not form a uniform coalition on the international climate agenda and discusses each country's decarbonization prospects for the coming years.
DIFFERENT EMISSIONS PROFILES
The BRICS countries have been major GHG emitters, in historical emissions and emissions patterns, since 1990. Historical emissions measure how much each country has contributed to GHG concentration in the atmosphere since 1850. The U.S. contributed most to this increase between 1850 and 2021, followed by three BRICS members: China, Russia, and Brazil; India ranks seventh and South Africa, sixteenth (Figure 1):
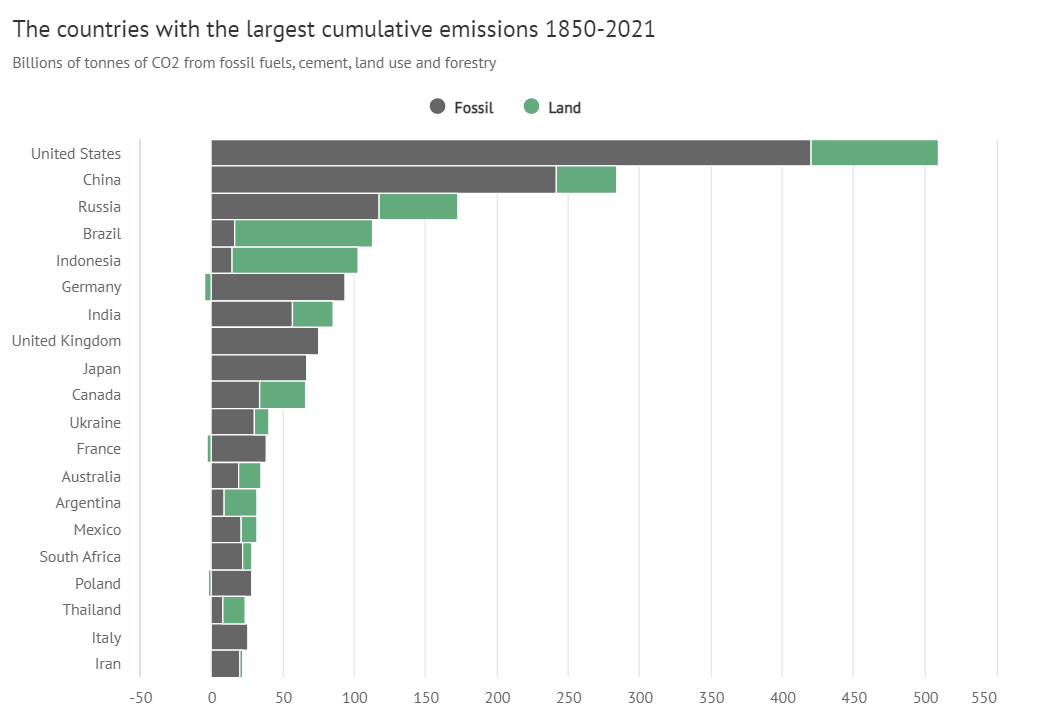
Figure 1: Countries with largest accumulated GHG emissions between 1850 and 2021. Source: Evans (2021).
Regarding the emissions pattern, China ranked second in 1990, behind only the United States; Russia came in third, followed by Brazil; India ranked eighth and South Africa, nineteenth. By 2019, China had become the largest global GHG emitter; India ranked third, followed by Brazil; Russia ranked sixth and South Africa, sixteenth (Table 1).
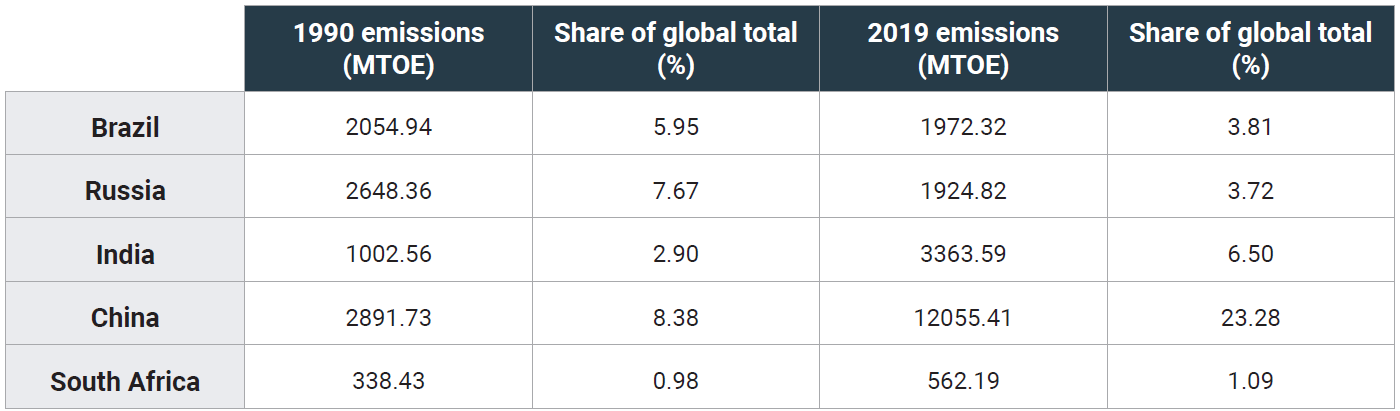
Table 1: BRICS, GHG emissions in Mega Tonnes of Oil Equivalent (MTOE), and share of global total, 1990 and 2019. Source: Authors' calculations using the Greenhouse Gas Emissions and Removals Estimates (SEEG 2022), Climate Watch Data (2022) and World Bank (2022) information.
Per capita emissions decreased in Russia and Brazil between 1990 and 2019. They increased in other BRICS countries, but their relative position in comparison to other G20 countries[1] changed: Russia ranked fourth in per capita emissions among the G20 countries in 1990 and fifth in 2019; Brazil ranked sixth in 1990 and eighth in 2019; South Africa ranked tenth in 1990 and seventh in 2019; China ranked nineteenth in 1990 and twelfth in 2019; and India ranked twentieth in 1990 and in 2019.[2] The GHG intensity of all BRICS economies decreased in that same period (Table 2).
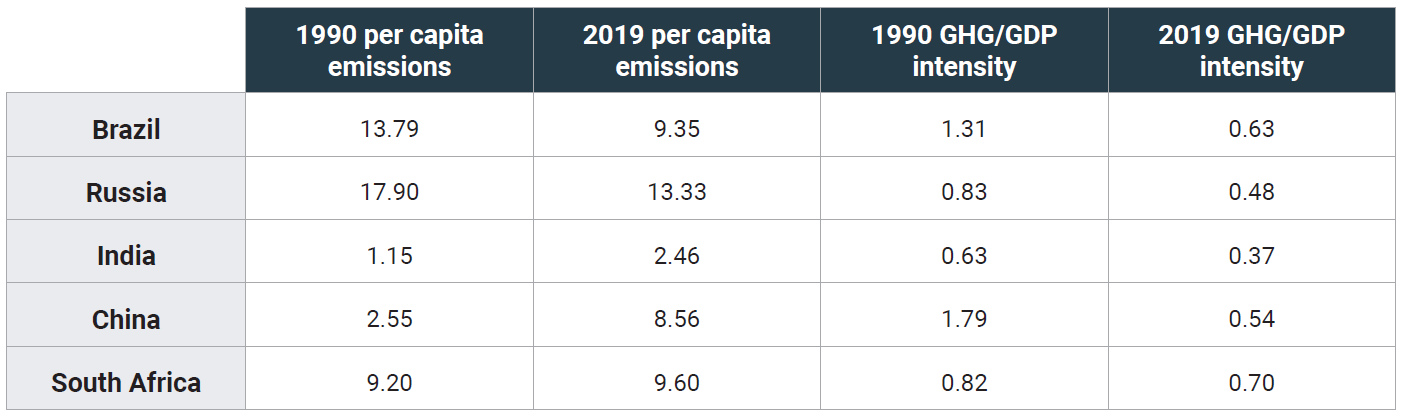
Table 2: BRICS, per capita emissions and Gross Domestic Product (GDP) GHG intensity, 1990 and 2019. Note: Per capita emissions in tonnes of CO2 equivalent; GDP GHG intensity in MtCO2e/billion, constant international 2017 US$, Purchasing Power Parity (PPP). Source: Authors' calculations using SEEG (2022), Climate Watch Data (2022) and World Bank (2022) information.
BRICS countries have different emissions profiles. Between 1990 and 2019, Chinese GHG emissions increased by 317%; China's share of total global emissions increased 2.78-fold in the same period (Table 1). China's energy sector accounts for the largest portion of the country's emissions: 81.64% in 1990 and 88.08% in 2019; industrial emissions increased by 349.82% in that timeframe.[3] Agriculture and industrial processes swapped places as second and third largest emitters (Table 3), reflecting the transformation of China's economy in the period. Land use and forestry emissions have been negative in China since 1990; in absolute figures, carbon sequestration by that sector nearly doubled between 1990 and 2019 but the sector's relative share decreased (Table 3).
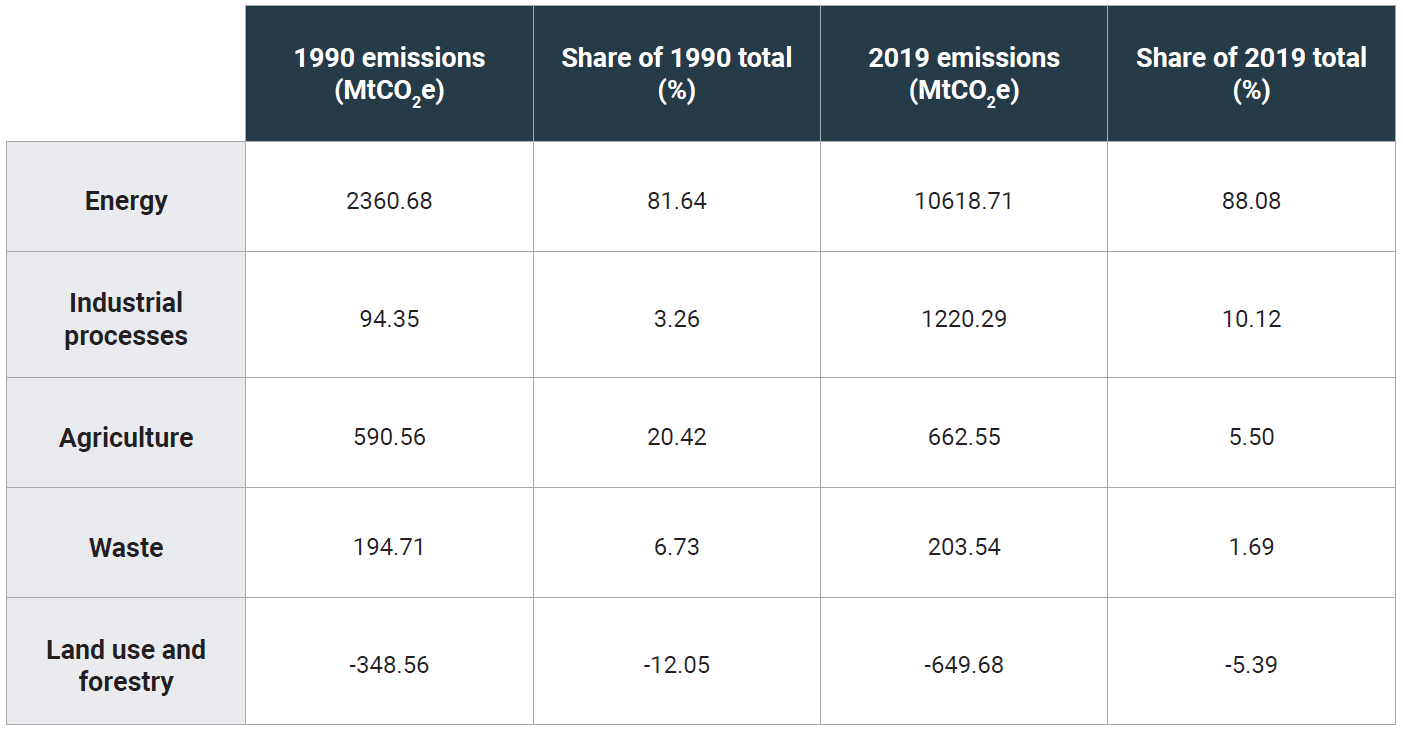
Table 3: China, emissions profile, 1990 and 2019. Source: Authors' calculations using Climate Watch Data (2022) information.
India’s GHG emissions grew by 79.87% between 1990 and 2019. The energy sector answers for the largest share of total emissions and its relative weight increased in the period (Table 4). The agriculture sector comes second and its relative share is diminishing. Emissions from industrial processes and waste also increased between 1990 and 2019 but remain quite low in relative terms. Land use and forestry emissions are negative and have been diminishing progressively both in absolute and in relative terms (Table 4).
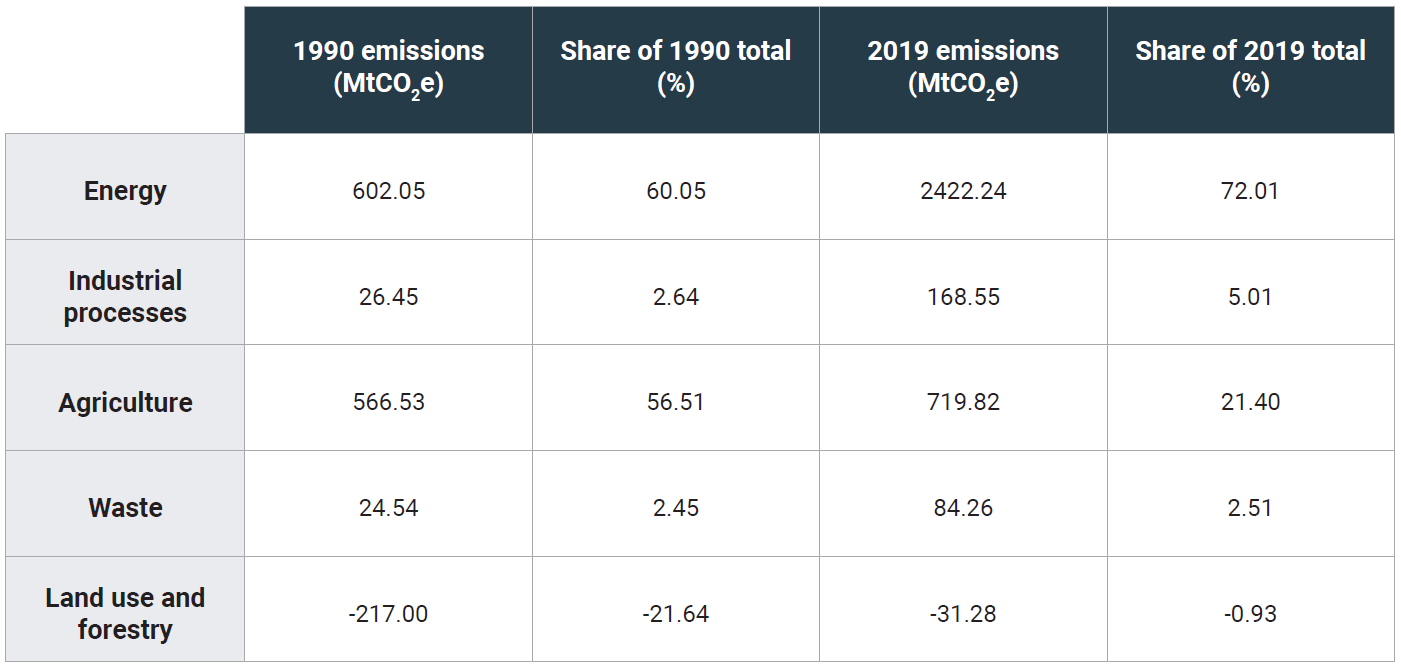
Table 4: India, emissions profile, 1990 and 2019. Source: Authors' calculations using Climate Watch Data (2022) information.
The 27.33% reduction in Russian emissions between 1990 and 2019 (Table 1) was due to the economy’s slowdown and not to efficiency gains or to decarbonization. The energy industry accounts for almost all of Russia's positive emissions. Emissions from agriculture decreased between 1990 and 2019. Those from industrial processes and waste increased but their share of Russia's total remains small (Table 5). Land use and forestry emissions have been negative since 1990 and both their absolute emissions and relative share of total net emissions increased between 1990 and 2019 (Table 5).
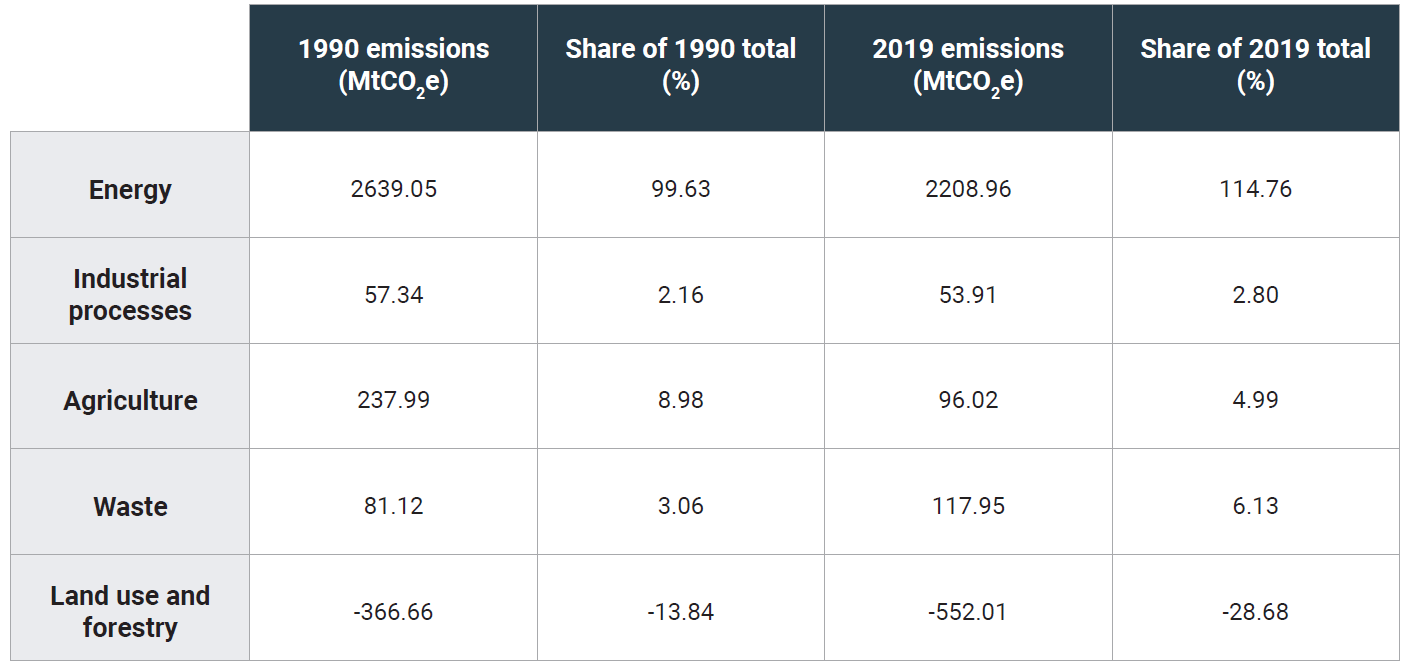
Table 5: Russia, emissions profile, 1990 and 2019. Source: Authors' calculations using Climate Watch Data (2022) information.
Brazil's emissions profile differs from that of other BRICS countries. First, land use and forestry have since 1990 accounted for the largest share of Brazil's total emissions and remains well above other sectors' shares (Table 6). The reduction in emissions from this sector answered for the drop in Brazil's total emissions from 1990 to 2019 (Tables 1 and 6). Second, the share of energy-related emissions is less significant than other BRICS countries but is increasing in absolute and relative terms. Third, the agriculture sector also plays an important and growing role in emissions, although smaller than the energy sector (Table 6). Finally, emissions from industrial processes and waste also grew in the period but still amounted to less than 10% of total emissions in 2019 (Table 6).

Table 6: Brazil, emissions profile, 1990 and 2019. Source: Authors' calculations using SEEG (2022) information.
South Africa emits much less than other BRICS countries but its per capita emissions lagged behind only Russia's and Brazil's in 1990 and Russia's in 2019, while its Gross Domestic Product (GDP) is the most carbon-intensive of all five countries (Table 2). Since 1990, its energy sector has accounted for more than three quarters of total emissions (Table 7). Emissions from agriculture decreased between 1990 and 2019 both in absolute and in relative terms (Table 7). Emissions from industrial processes and waste increased, but continued to account for less than 10% of total emissions in 2019. As in Brazil, emissions from land use and forestry are positive in South Africa but lower in absolute and in relative terms when compared to Brazil (Table 7).
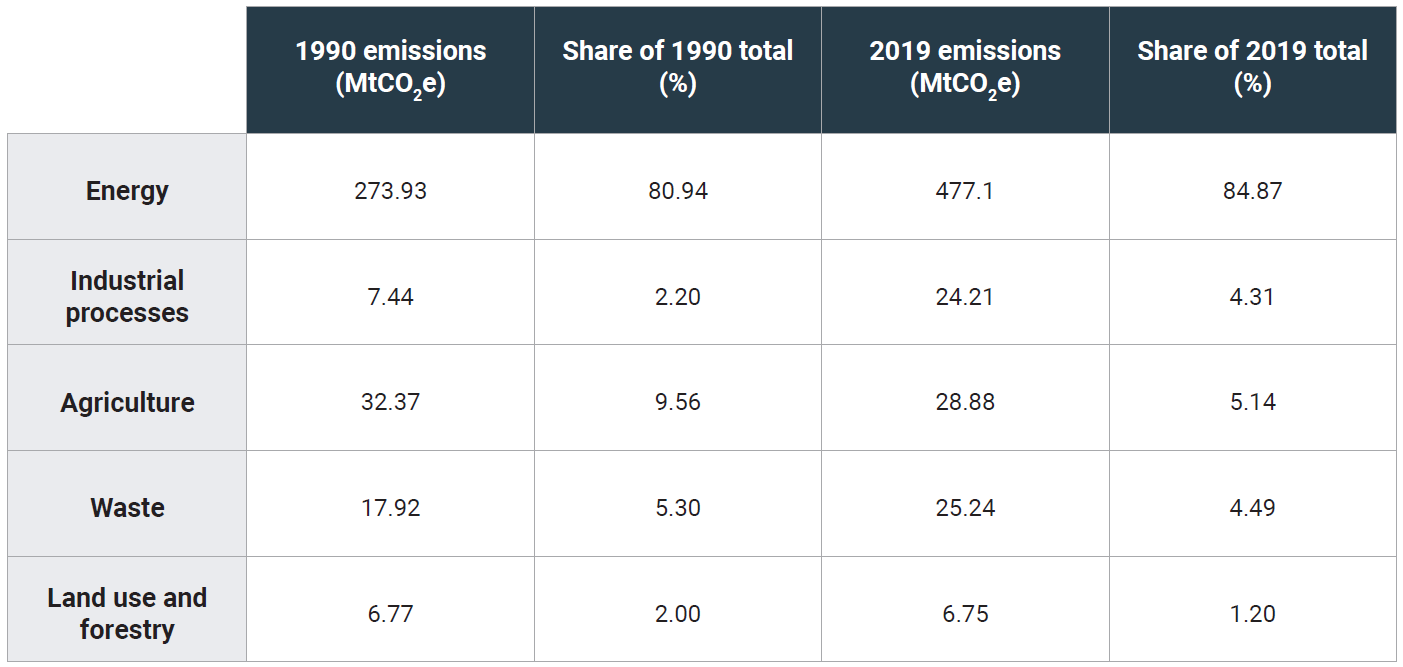
Table 7: South Africa, emissions profile, 1990 and 2019. Source: Authors' calculations using Climate Watch Data (2022) information.
DECARBONIZATION PROGRESS IN BRICS COUNTRIES
China
Decarbonizing China means transforming its energy mix. China answered for up 21% of global total energy in 2019 (IEA 2021). China is the largest producer (49.7% of global production in 2020) and importer of coal, most of which is used to generate power – 65.25% of China's electricity generation in 2019 was coal-fired (IEA 2021). China is the largest oil importer and has the second largest global refining capacity (IEA 2021). China ranks first globally in power generation from renewable sources. Hydro, wind, and solar photovoltaic power plants accounted for 27.21%, 33.76% and 34% of installed capacity in 2019, respectively (IEA 2021). China's economy remains very energy-intensive – 187.69 kilograms of oil equivalent for every US$1,000, compared to the Organisation for Economic Co-operation and Development’s (OECD) 97.55 kg average[4] – as a result of the national Communist Party’s economic choices.
Until the 1970s, China was an agrarian economy. Light, labor-intensive manufacturing ballooned from 1978 to 2001, when the trend reversed: the expansion of heavy industry increased the demand for energy and GDP energy intensity (Rosen & Houser 2007, 09). Urbanization also requires more energy, especially for electricity and transportation: China's urban population went from 26% in 1990 to 63% in 2021 (World Bank 2022).
The 11th Five-Year Plan (2006-2010) already included energy transition targets (Fan 2006, 709). The Plan aimed to cut GDP energy intensity by 20% from 2005 levels and increase the share of non-fossil energy to 10% of China's total consumption by 2010 and 15% by 2020. To achieve these targets, China kicked off the National Climate Change Program in 2007. During the 2008 global financial crisis, it earmarked 35% of its US$850 billion economic stimulus package toward low-carbon development. The policies then implemented included, among others: the energy conservation act (China 2007); energy efficiency regulations for buildings (China 2008); and the renewable energy act, updated in 2009 to regulate grid connection, special rates, tax exemptions and research and development funding for renewable energy (China 2009).
In the 12th Five-Year Plan (2011-2015), China proposed to reduce carbon intensity of its GDP by 17% and energy intensity of its GDP by 16% by 2015 from 2005 levels and that at least 11.4% of its energy supply should come from non-fossil sources (China 2011). To achieve these targets, China created incentives for electric vehicles and for renewable power generation as well as plans to make coal-fired power plants more efficient (China 2014a). The 2014 National Plan to Combat Climate Change introduced into Chinese domestic regulations the voluntary targets under the international climate regime China had unveiled at the 2009 COP 15: (i) reduce GDP carbon intensity by 40-45% by 2020 from 2005 levels; (ii) increase by 15% the share of non-fossil energies in total consumption and bring the installed capacity for renewable energies to 650 GW by 2020;[5] (iii) add 40 million hectares of forests and increase forest stocks by 1.3 billion cubic meters by 2020 (China 2014b). China then shut down most obsolete coal-fired power plants, improved fuel quality and invested massively in public transit systems. Nonetheless the growth in private vehicle production and sales caused large-scale and long traffic jams in major Chinese cities.
In the 2015 Paris Conference, China submitted its Nationally Determined Contribution (NDC) including the following: Chinese emissions were to peak by 2030; (ii) GDP carbon intensity was to be cut by 60-65% by 2030 from 2005 levels; (iii) the share of non-fossil energies in the energy matrix was to increase to 20% by 2030; (iv) forest stocks were to increase to 4.5 billion cubic meters by 2030 (China 2015). Regulations were then changed to pave the way to achieve NDC targets. The 1987 air pollution legal framework was updated in 2015 to include a ban on residential use of low-quality coal. In 2016, hydrogen was included in the list of technologies deemed strategic to increase energy security and combat climate change in China (China 2016). The 1995 electricity act was updated in 2018 to encourage generation from renewable sources (China 2018). In 2020 China created a legal framework for the Chinese auto industry to expand investments in electric and fuel cell vehicles and approved subsidies for the electrification of public transportation, private use, light, heavy and rail vehicles (China 2020).
The 14th Five-Year Plan approved in 2021 confirmed the 2030 peak emissions and the 2060 carbon neutrality targets (China 2021a). The plan calls for these targets to be implemented through emissions control measures for industries and businesses; use of ecosystem services to achieve carbon neutrality; promoting efficient coal use and the transformation of energy-intensive industries (steel, petrochemicals, cement); increased use of railways and waterways for freight transportation; investment in energy efficiency technologies, carbon neutrality and carbon capture, sequestration, use, and storage (CCUS) (China 2021a). Two action plans were approved in that same year regarding peak emissions by 2030 and energy saving and emissions curbing (China 2021b, China 2021c). Together, these plans expanded incentives, subsidies, and investment, including for research and development, in green and low-carbon energy technologies, including in efficiency and storage. Also in 2021, China submitted its first updated NDC; confirmed the peak emissions and GDP carbon intensity targets presented in 2015; increased to 25% the 2030 target for non-fossil energy share in the mix and to six billion cubic meters the 2030 target for forest stocks; and added the 1.2 billion kW target for wind and solar installed capacity (China 2021d). In 2022, China approved plans to accelerate the modernization of its energy sector and to curb emissions in its heaviest polluting industries (China 2022a; China 2022b).
Given its level of emissions and its participation in global energy chains, including in low-carbon technologies, China is the most important player in the global decarbonization process. It follows that China's decarbonization progress is a sine qua non condition for consistent international progress.
China was a conservative country in the climate regime (Viola et al. 2013,) but its public policies and international climate commitments show China has transitioned to a moderately conservative position. This change was driven by domestic and foreign policy factors. The former are associated with concerns about air pollution, whose extremely high levels in the 2000s put pressure on the communist party's legitimacy. The latter stem from China's ambition to take a more significant role in global governance. Given its level of emissions and its participation in global energy chains, including in low-carbon technologies, China is the most important player in the global decarbonization process. It follows that China's decarbonization progress is a sine qua non condition for consistent international progress.
India
India is the world's second largest coal producer and importer. Like China, India uses coal largely for power generation – 72.72% of total generation in 2019 (IEA 2021). India also is an energy-intensive economy: 124.41 kilograms of oil equivalent for every US$1,000.[6] India's per capita energy consumption in 2014 was 2.35 times lower than Brazil's, 3.5 times lower than China's and 6.3 times lower than the OECD's (World Bank 2022). In 2020, 459 million Indians relied on biomass (mainly firewood) for cooking and 138 million had no access to electricity.[7]
Until 2014, India maintained a Planning Commission that published Five-Year Plans. Climate change was first mentioned in the 11th such plan (2007-2012), which recognized it as "one of the most serious concerns of our time" (India 2007, 203). India then proposed to cut the energy intensity of its economy by 20% by 2017 compared to 2007-2008 levels and to increase energy production from renewable sources (India 2007, 205-207). The 2008 National Climate Change Action Plan sought to use feed-in rates for renewable energy and other tools to increase solar thermal and photovoltaic power generation by at least 1000 MW by 2017, and enhance energy efficiency so as to save at least 10,000 MW by 2012 (India 2008). In 2009, India introduced in the international climate regime its voluntary target to cut GDP carbon intensity by 20-25% by 2020 from 2005 levels. That was to be achieved through stringent standards for fuels and for the energy efficiency of buildings, by increasing forest cover to capture at least 10% of annual emissions and by expanding the share of wind, solar and small-scale hydroelectric power in the mix from 8% to 20%. In that same year, the Indian government approved a National Biofuels Policy proposing a 20% ethanol blend to fuels sold in the country and a minimum price to encourage production (India 2009).
Climate change lost significance in the 12th plan (2012-2017), and is now seen as an issue to be faced within the framework of sustainable development – mainly through eco-efficiency and low-carbon growth (India 2013, 113-117). Low carbon is deemed important to improve energy access and energy security by reducing coal production and coal, oil, and gas imports. The plan called for renewable energy to reach 30 MW of total consumption by 2017 and 75 MW by 2022, both from 2012 levels (India 2013, 132-135). The 2012 National Electricity Plan sought to modernize thermal power plants, including through the introduction of clean coal technologies, and to expand distributed generation and introduced mandatory purchase of power from renewable sources for concessionaires supported with preferential rates. The National Electric Mobility Plan approved in that same year regulated electric vehicles.
In 2015, India submitted its NDC pledging to, until 2030: (i) cut its GDP energy intensity by 33-35% from 2005 levels; (ii) bring the installed capacity for power generation from non-fossil sources to 40% via technology transfers and low-cost international funding, including from the Green Climate Fund; (iii) create additional forest carbon sinks equivalent to 2.5-3 billion tonnes of CO2 (India 2015). Domestically, India reviewed its power regulation to include new targets for renewable energies and to expand the use of electric vehicles (India 2014, India 2016). In 2021, India submitted its first updated NDC with the following targets for 2030: (i) cut its GDP energy intensity by 45% from 2005 levels; (ii) reach 500 GW installed capacity for non-fossil power generation and bring the installed capacity for power generation from renewable sources to 50%; (iii) cut emissions by one billion tonnes (India 2021). During COP 26, India's Prime Minister Narendra Modi also mentioned the goal of neutralizing emissions by 2070, but gave no details. India's original NDC was deemed highly insufficient. Its new NDC involves a more ambitious contribution to mitigating global climate change but remains insufficient (Climate Action Tracker 2022).
India is a conservative player in the climate regime and is one of the most active advocates of common but differentiated responsibilities and the doctrine of historic responsibilities.
India is a major energy importer and therefore is very sensitive to changes in global energy markets. The energy transition to renewable sources benefits India by reducing its dependence on imports, improving energy security and expanding access to the population that still does not receive energy services. India is a conservative player in the climate regime and is one of the most active advocates of common but differentiated responsibilities and the doctrine of historic responsibilities. India's myriad of energy transition policies hide conflicting interests: first, the country's vast coal reserves and large-scale production, which enhance energy security and access to energy services; second, the ingrained fragmentation of India's political system, which severely thwarts the adoption of coherent national policies and their uniform countrywide implementation; third, the anti-colonial discourse, which shuns important mitigation actions by holding only industrialized countries responsible for the problem – even though India is among the countries most vulnerable to climate change; fourth, the extreme poverty in which a substantial part of the Indian population lives.
Russia
Russia is the world's second largest oil producer and exporter; second largest producer and largest exporter of natural gas; and third largest coal exporter, according to 2019 data (IEA 2021). Natural gas accounts for 45.89% of Russia's electricity in 2019 (IEA 2021). Russia is an energy-intensive economy: 186.74 kg of oil equivalent for every US$1,000 in 2014 (World Bank 2022). It is one of the world's largest energy exporters. Indeed, Russia's exports of three hydrocarbons (coal, oil, and natural gas) makes it the world's largest exporter of fossil fuels. This means that for Russia energy is not only a means for development and a necessity for the well-being of its population; it is a national business of global proportions, explains many of the inconsistencies in Russia's energy decarbonization policies.
Russia is the only BRICS country included in Annex I to the Framework Convention on Climate Change, so it had emissions reduction obligations under the Kyoto Protocol. Its goal during Protocol negotiations was to maximize sales of carbon credits ("hot air") to other developed countries. When the Kyoto Protocol was ratified, and the United States withdrew, Russia realized that the market for "hot air" would be smaller than anticipated. A better understanding of the market economy led Russia to ratify the Kyoto Protocol in exchange for its accession as a member of the World Trade Organization. Russia met its goal of reducing its 2008-2012 emissions in relation to 1990 levels, but that was due to an economic slowdown rather than to the decarbonization efforts.
Russia introduced energy efficiency regulations in 2001. The 2014 State Energy Efficiency and Energy Development Program (Russia, 2014), which replaced Russia's 2030 Energy Strategy enacted in 2003 and amended in 2009, is very significant. The program proposes to reduce Russia's GDP energy intensity by 40% between 2007 and 2020 and to increase the share of renewable sources in the power generation mix, but the 2014 update reviewed that target down from 4.5% in 2020 to 2.5% in 2030. The program further seeks to encourage renewable energies through incentive mechanisms for wind, solar photovoltaic, and small-scale hydropower generation (Russia 2013). Russia's 2009 Climate Doctrine is a non-binding declaration that recognizes the danger of climate change, anthropogenic influence, and the importance of improving energy efficiency and of expanding the share of renewable energy (Russia 2009).
Russia is an extremely conservative player in the climate regime and its engagement is very peculiar.
Russia is an extremely conservative player in the climate regime and its engagement is very peculiar. In the COP 15, Russia pledged a 15-25% reduction in GHG emissions compared to 1990 levels. The range depends on (i) "appropriate accounting of Russia's forestry potential within the framework of contributing to meeting obligations to reduce anthropogenic emissions;" and (ii) on "major emitters having legally binding obligations to reduce emissions" (Russia 2015). In its NDC, Russia committed to limiting its emissions to 70-75% of the 1990 total by 2030, the exact absorptive capacity of its forests (Russia 2015). None of those targets is ambitious considering that Russia's 1990 emissions were extremely high because they encompassed the total for the former Soviet Union. Russia's first NDC update, submitted in 2020, included milder ambitions: limiting emissions to 70% of the 1990 level by 2030, taking into account the "absorptive capacity of forests and other ecosystems and subject to sustainable and balanced social economic development of the Russian Federation" (Russia 2020). In October 2021, Russia announced its effort to achieve carbon neutrality by 2060 without reducing the use of fossil fuels, which are important drivers of Russia's development and job creation, in line with the idea of changing land use and using the forestry sector for carbon sequestration purposes (UN News 2021).
That change is in line with Russia's increasingly refractory stance towards multilateral cooperation in recent years. Two other documents that are significant for the decarbonization process were approved in recent years. Russia's (2019) Energy Security Doctrine describes "increased efforts to implement climate policies and to accelerate the transition to a green economy as a foreign policy challenge to Russian security" (Russia 2019). Quoting:
…to consider issues of climate change and environmental protection from a biased point of view, infringe on the interests of energy producing states and deliberately ignore such aspects of sustainable development as ensuring universal access to energy and developing clean hydrocarbon energy technologies.
In 2021, Russia updated its 2015 National Security Strategy (Russia 2021) to claim that the international community uses climate change as a pretext to "restrict the access of Russian companies to export markets, to curb the development of Russian industry, to establish control over transportation routes and to prevent Russia from developing the Arctic."
South Africa
South Africa is a country smaller than the first three BRICS, but punches above its weight in the international energy market: in 2020, it was the seventh largest producer and fourth largest exporter of coal (IEA 2021). Most of South Africa's power generation (89.70% in 2020) is coal-fired (IEA 2022a). Power generation from renewable sources represents a small but growing share of South Africa's total energy consumption: wind power accounted for a mere 0.13% of energy consumption in 2010 but for 2.52% in 2020; solar power went from nil in 2010 to 0.15% in 2020 (IEA 2022). South Africa's economy is energy-intensive – 191.98 kg of oil equivalent for every US$1,000 in 2014 – and shows the highest per capita energy consumption among BRICS countries – 2.6 Tonnes of Oil Equivalent (TOE) in 2014 (World Bank 2022). South Africa's huge inequality also affects access to energy; per capita figures reflect the economy's dependence on highly energy-intensive industries such as mining and not a consumption pattern that improves the population's living standard.
South Africa was transitioning from authoritarian apartheid to democracy as climate change gained traction in the international agenda. (...) South Africa's energy transition faces multiple challenges…
South Africa was transitioning from authoritarian apartheid to democracy as climate change gained traction in the international agenda. The apartheid regime was based on racial segregation and on the domination of a few over the country's economy, which not only produced profound social inequalities but also led to South Africa's international isolation through embargoes. South Africa used its coal not only to generate power – in thermal plants that could afford to be inefficient given the abundance of the primary source – but also converted it into liquid fuels for domestic use in circumvention of international oil trade bans. South Africa's energy transition faces multiple challenges: first, coal's dominance in the energy mix; second, the weight of coal mining and other energy-intensive industries in GDP; third, the importance of the coal production chain as a source of jobs, both low-skilled jobs, but plentiful in coal-producing regions, and high-skilled ones, including in a significant energy industry bureaucracy. Finally, the association with post-apartheid black empowerment policies: ownership of coal mines promoted the rise of some groups, but renewable technology remains in the hands of foreign joint ventures that create few jobs and little revenue and that do not enhance the social status of national groups.
Energy efficiency has been a significant item in South Africa's political agenda since democratization. The inefficiency of thermal power plants and increased demand in times of economic growth unaccompanied by a corresponding expansion in generation have forced the country to ration its supply of power – a practice known as load shedding. South Africa joined the BASIC alliance in 2009 and submitted a 34% voluntary reduction target in relation to its projected emissions growth by 2020 (South Africa 2010). The commitment meant little from a climate perspective given the baseline; however, it was in line with the Zuma administration's foreign policy seeking to build new partnerships and to raise South Africa's international standing. South Africa put its first climate policies in place in the run-up to the 2011 COP 17 held in Durban. South Africa's candidacy to host that meeting was part of its new foreign policy vision. A National Climate Change Response Policy White Paper was published with two main objectives: to build an emergency response capacity to manage the impacts of climate changes on South Africa and to make a fair contribution to the global effort to stabilize GHG concentrations in the atmosphere (South Africa 2011). In addition to initiatives in various sectors such as agriculture, water and disasters, the policy states the importance of carbon pricing in any long-term mitigation strategy.
In its NDC, South Africa committed to maintain its emissions by 2030 between 398 and 614 MtCO2-eq (South Africa 2015). The 2016 National Greenhouse Gas Emissions Reporting Regulation introduced a national GHG inventory for the energy, transportation, industry, agriculture and forestry sectors to inform the design and implementation of legislation and public policies (South Africa 2017). The 2050 Green Transport Strategy, published in 2018, is a long-term plan to improve the efficiency, integration and sustainability of transportation systems, aligning the sector's objectives with a fair transition to a low-carbon economy (South Africa 2018). Major energy transition regulations were approved in 2019 when South Africa was preparing its NDC update.
First came a carbon tax (South Africa 2019a).[8] The tax amount is low – US$8 in early 2022 – but in the COP 26 South Africa committed to progressively increase it to US$20 by 2025 and to US$30 by 2030. Then the National Energy Efficiency Strategy set out the financial and fiscal incentives that would be rolled out to cut South Africa's final energy consumption by 29% (South Africa 2019b). The Integrated Resources Plan described an energy transition strategy for the mining and energy sectors (South Africa 2019c). The plan included broad propositions such as recognizing the impacts of coal mining on climate change and on the health of the population; the importance of carbon sequestration and storage technologies to reduce the sector's externalities; proposals for a carbon budget and for low-carbon technologies – including the government's commitment to expand installed wind and solar capacity – to facilitate the transition.
South Africa was severely hit by the COVID-19 pandemic. The impact on human life was enormous and the economic slowdown significant: electricity consumption, for example, was 10% lower in 2020 compared to 2010 (IEA 2022a). In 2020, the South African government launched the Economic Reconstruction and Recovery Plan, an economic stimulus package including targets for infrastructure, green financing, and other green economic interventions. In 2021, South Africa submitted its first NDC update with increased ambitions: South Africa pledged to maintain its total emissions between 398 and 510 MtCO2e by 2025 and between 350 and 420 MtCO2e by 2030 and to achieve net zero emissions by 2050. If all said measures are implemented, South Africa will transition from conservative to moderately conservative country status in the climate regime.
Brazil
Brazil's energy mix is relatively low-carbon: 49.28% of the energy consumed in 1990 and 46.03% in 2019 came from low-carbon sources (EPE 2022). Brazil's economy is not energy-intensive – 94.95 kg of oil equivalent for every US$1,000 in 2014 (2017 constant Purchasing Power Parity) – and its per capita energy use was 1.49 Tonnes of Oil Equivalent (TOE) in 2014. Brazil is energy self-sufficient and boasts state-of-the-art technology in deep-water oil production, hydropower generation (especially in reservoir design) and in power and fuel (ethanol) production from sugarcane.
Most of Brazil's GHG emissions come from change in land use and from forestry. In the second half of the 2000s, Ministers of Environment Marina Silva and Carlos Minc led a fresh drive to contain deforestation through a better institutional framework. Improved staffing and equipment and more stringent oversight and enforcement of the law caused timber seizures and the application of fines to soar. Deforestation rates retreated from 24,000 km2 in 2004 to 6,200 km2 in 2010 in the Amazon and from 12,200 km2 to 6,100 km2 in the same period in the Cerrado (MapBiomas 2022). From 2015, budget constraints due to the worsening economic crisis crippled on-site deforestation control activities and reduced the issue's appeal to public opinion, dampening the pressure for action (Ryan 2017). Between 2016 and 2018, the effects of the economic crisis were compounded by President Temer's fear of impeachment in the wake of the JBS scandals, which leveraged the farmer caucus’ bargaining power to extract concessions from the Federal Government. The Federal Government's anti-environmental policy from 2019 disrupted the fight against deforestation, causing rates to balloon in the Amazon. If deforestation is again contained, agriculture and energy will lead Brazil's emissions, as happened in 2010-2015.
Wind and biomass share in the power mix increased simultaneously with natural gas. During the 2001-2002 power crisis, the Federal Government created the Alternative Power Sources Incentive Program (PROINFA), to stimulate the development of small-scale hydro and of wind or biomass power plants (Brazil 2002),[9] and the Priority Program for Thermal Power Plants, to take advantage of gas supplied through the Brazil-Bolivia pipeline and to cause Petrobras to invest in the construction of thermal power plants. Incentives for solar power were introduced only from 2014 onward and mainly for distributed generation. The transportation industry's emissions are heavily associated with Brazil's reliance on highways and on diesel vehicles for freight transportation.
The 2008 National Plan on Climate Change included emissions curbing targets across all sectors (Brazil 2008). In 2009, the Plan was subsumed into the National Policy on Climate Change (Brazil 2009). The policy internalizes the voluntary emissions reduction proposal Brazil submitted in the COP 15: 36-39% reduction in relation to projected emissions growth by 2020 and 80% reduction in deforestation by 2020 from 2005 levels (Brazil 2010). The decrease in deforestation then in course would allow Brazil to easily meet that unambitious target (Viola & Franchini 2018).
In 2015, Brazil submitted its NDC proposing to cut emissions by 37% by 2025 and 43% by 2030 compared to 2005 levels (Brazil 2015). The NDC was updated in 2020 to maintain those percentages (Brazil 2020) but reviewing from 2.1 GtCO2e to 2.8 GtCO2e Brazil's total emissions from land use change in 2005 (MCTI 2016).[10] This review "authorized" Brazil to emit much more in absolute terms under its updated NDC than under the original NDC. Brazil again updated its NDC in 2021 to increase the emissions reduction target from 43% to 50% by 2030 in relation to 2005 levels (Brazil 2022). The new update partly corrected the 2020 distortion but crystallized a 0.31 GtCO2e increase for 2025 and 0.08 GtCO2e increase for 2030 in relation to the 2015 NDC target (Unterstell & Martins 2022).
The erratic behavior of Brazil's deforestation emissions have caused Brazil's position in the climate regime to fluctuate: conservative until 2004; moderate from 2005 to 2010; moderately conservative from 2011 to 2015; conservative from 2016 to 2018 (Viola & Franchini 2018); and extremely conservative from 2019 to 2022.
THE CURRENT SITUATION AND ITS IMPACT ON THE DECARBONIZATION OF BRICS COUNTRIES
The international system was transformed by three critical events that are now unfolding: the increasingly conflictive relationship between China and the United States; the COVID-19 pandemic, which acute phase (March 2020 to April 2022) is now behind us but that continues and may break out anew; and the war in Ukraine, with very profound impact.
Since the 2008 global financial crisis, the perception has grown within the Chinese Communist Party that American/Western democracy is decadent and that the combination of Marxism-Leninism with Confucian meritocracy, under which the Chinese economy has risen, offers an alternative for humanity. Chinese policy has taken an increasingly aggressive military tinge: occupation and militarization of islands in the South China Sea; technological improvement of the armed forces – the cyberwarfare complex has become powerful and Chinese navy presence in the western Pacific is now superior to America's and, more recently, China's nuclear arsenal has grown substantially, particularly its intercontinental missile arsenal. China’s regime has at the same time become increasingly totalitarian: repression of and concentration camps for the Uyghur minority in Xinjiang; repression of the (little) freedom of expression that existed before, using social credits as an artificial intelligence-based tool for the far-reaching control of society; growing personality cult of Xi Jinping – whose level of power control is surpassed only by Stalin's and Mao's – and suppression of other groups within the Communist Party; heavy-handed repression in Hong Kong; and growing saber-rattling in relation to Taiwan. Trump's rise in the United States on the back of a discourse that defined China's autocracy as a threat contributed to increase the animosity. Tensions worsened with the war in Ukraine and put paid to the preceding phase of growing U.S.-China economic interdependence and cooperation on global issues, including climate change, kicking off what many analysts define as Cold War 2.0.
The COVID-19 pandemic has had an ambivalent impact on the international system. After more than two years, the pandemic has not changed the upward trajectory of global emissions: they fell by 5% in 2020 but grew again, by 6%, in 2021 and will probably grow more in 2022. Nationalism increased in response to the pandemic but more global cooperation is the most effective combat action.[11] Public economic stimulus policies also differed: the European Union deepened its Green Economy Program, and the U.S. Democratic Party incorporated it into its electoral platform in July 2020, but several other growth packages do not take decarbonization into account.
The war in Ukraine changed international parameters and created uncertainty in relation to the future. Western response to the invasion and Ukrainian resistance surprised Putin and the Russian military, whose expectations probably were based on the response to the 2014 annexation of Crimea. Western support for Ukraine, sufficient for Ukraine to resist but not to win the war, and sanctions on Russia that were unimaginable before the invasion mean that limited war between Russia and the North Atlantic Treaty Organization (NATO) has been raging in Europe since March 2022. The war has also increased the nuclear threat, now at a level not seen since the Cuban missile crisis in October 1962.
How do the three critical junctures and their interrelation with emissions and climate policies trajectories will influence decarbonization in BRICS countries in coming years?
The war in Ukraine affects the international energy market. Russian oil and natural gas exports were redirected from Europe to China and India. On the one hand, the reduction in gas sales to Europe hampers decarbonization in the short term – Europe had largely replaced coal with Russian gas for power generation and the trend reversed in 2022: the International Energy Agency projects 7% growth in coal use in the European Union in 2022 (IEA 2022b). However, in the medium and long term, investments in renewable energies, especially wind and solar power, will continue for decarbonization and energy security purposes. On the other hand, the increased supply of Russian gas and especially oil to China and India may reduce the appeal of energy efficiency and decarbonization action in the short term, especially in India.
Some inertial forces contribute for the continuation of China's decarbonization process in coming years: first, the position of Chinese industry in global renewable technology chains and China's severe air pollution problem favor expanding the share of low-carbon sources in the mix; second, China's policy to reach peak emissions by 2030 and carbon neutrality by 2060 include reforestation projects to increase carbon capture and sequestration. Planted forest areas have consistently grown in China since 1999 (Liang et al. 2022, Tong et al. 2020) – even though they do not contribute to biodiversity and cause other environmental imbalances such as water stress (Zhang et al. 2021) when planted in areas originally occupied by other types of vegetation; third, China's vulnerability to climate change and the increased intensity and frequency of extreme weather events such as heat waves and floods in the summer of 2022. Those factors influence those in the Chinese Communist Party who wish decarbonization efforts to proceed. Other groups oppose that wish and advocate expanding the use of coal to increase China's energy and national security, since gas and oil are imported. The most likely outcome is that those two opposing forces will continue to coexist.
India's recent transition from an electoral democracy to an electoral autocracy (Boese et al. 2022) was fueled by a growing an ethnic and religious nationalism that gives priority to some groups and excludes others (Harari 2018), coupled with anti-colonialist resentment. The rise of nationalism in the international system in recent decades has reduced engagement with issues of common interest such as climate change. That position creates a paradox: as a major energy importer, India takes advantage of the currently low international price of oil to import more and uses its coal to generate power to improve its energy security; at the same time, India is one of the world’s most vulnerable countries to climate change – certainly the most vulnerable among BRICS countries.
Russia has never been truly engaged in decarbonization. Russia's recent energy security and national security doctrines show the Russian government's growing paranoia about climate change and the chances of Russia engaging in multilateral cooperation in the short term are virtually nil. Russia will potentially further increase its GHG emissions in the coming years: the thawing of the permafrost that covers much of Russia's central and eastern territory will release large amounts of methane into the atmosphere.
South Africa's decarbonization process faces some major hurdles. The ambition to implement a US$20 carbon tax by 2025, increasing to US$30 in 2030, which will be by far the highest among BRICS countries and one of the highest in the world, is very positive yet not very credible, given South Africa's energy structure and powerful coal lobbies. South Africa's dependence on coal will decrease only through far-reaching structural reform to diversify the economy, accompanied by efforts to reduce the unemployment and inequality rates that severely plague the country.
Brazil is the BRICS country best positioned to accelerate decarbonization. Regarding land use change and forestry, the new federal administration that took office in 2023 is expected to lead a fresh drive to contain deforestation through better oversight and more stringent enforcement.
Brazil is the BRICS country best positioned to accelerate decarbonization. Regarding land use change and forestry, the new federal administration that took office in 2023 is expected to lead a fresh drive to contain deforestation through better oversight and more stringent enforcement. The newly elected and more conservative Congress will resist the Federal Government's efforts to certify indigenous lands, create conservation units and curb mining. But, a potentially benign nationalism that sees protecting the environment – the Amazon in particular – as a significant component of the national identity may help the government garner support. On the agriculture and livestock farming front, the use of advanced production technologies such as the crop-livestock-forest system is increasing. More stringent international environmental standards for agricultural and livestock products also contribute to Brazil's decarbonization given the sector's participation in global value chains. The energy sector has much to offer to advance decarbonization through additional wind and solar power generation and investments in green hydrogen production. That will require improvements to energy planning and to the currently poor maintenance of transmission lines and more investment in smart grids.
CONCLUSIONS
The world is at a crossroads. Human action has become the key driver of change in the planetary systems that make human life possible. The safe limits, including climate-related ones, within which the planet is able to maintain its resilience have been exceeded. The international negotiations to reduce GHG concentration in the atmosphere in course since the international climate change regime was created in 1992 have shown little progress. The 2015 Paris Agreement created a new framework within which each country agreed to indicate its GHG reduction targets and to from time to time provide more ambitious targets. The analysis of the prospects of international cooperation within this new model requires going beyond foreign policy analysis to understand the dynamics of each country's domestic politics.
The BRICS countries are significant climate policy players. They are major GHG emitters both in relation to historical levels and to their emissions trajectory since 1990. They also are major producers and consumers of fossil fuels, whose use since 1850 accounts for most of the GHG accumulated in the atmosphere. The engagement of BRICS countries is key for planetary decarbonization to succeed.
Each country follows a particular decarbonization process influenced by its emissions structure, energy mix and economic policy for emissions-heavy sectors.
China's partial success in decarbonization was driven by domestic pressure to curb air pollution and China's participation in the global low-carbon technology value chain. The land use change and forestry sector also brought some good news: large forests have been planted to operate as carbon sinks. But China's demand for fossil fuels and use of coal continue to grow. China accounts for half the global increase in emissions and its ambition to reach peak emissions in 2030 is wholly inconsistent with the global carbon budget. Today China is the largest emitter of GHG and no global decarbonization effort will succeed without its active participation; the fact that Cold War 2.0 between the United States and China is eroding their overall capacity for cooperation, including on climate change mitigation, is worrying. In addition to the severity of the problem, China's vulnerability to increasingly frequent and intense extreme weather events may work as an incentive for cooperation, albeit limited.
India is a conservative player in the climate regime and is one of the most active advocates of the doctrine of historic responsibilities. Its dependence on energy imports may operate as an incentive to decarbonize because advances in renewable energies will increase India's energy security. India's vast coal reserves are an incentive in the opposite direction and its growing ethnic and religious nationalism encourages India to find its own path on the international arena and reduces the appeal of international cooperation. The availability of Russian fossil fuels at discounted prices after the outbreak of the war in Ukraine pushes toward that same direction.
South Africa's decarbonization process faces some major hurdles. South African economy was built around the exploitation of coal and energy-intensive mineral commodity industries. The economy is poorly diversified, the unemployment and inequality rates created by apartheid-era discrimination remain and decarbonization is unlikely to advance without structural reforms. Russia is increasingly less committed to the climate agenda. The Russian government has resisted making emissions reduction commitments and, in recent years, adhered to climate denialism, with the aggravating factor that Russia sees the climate agenda as an international conspiracy to contain Russian development.
Brazil's circumstances differ from those of other BRICS countries. First, because Brazil's emissions profile is different: land use change and forestry, deforestation in particular, account for most of our emissions. Second, because Brazil made progress in decarbonization through the containment of deforestation from 2004 to 2012. Third, because despite domestic clashes over land use and agricultural policies, pressure from the international market for agricultural products operates as a powerful incentive to decarbonize. In the wake of the October 2022 elections, traditional and progressive players on land use policy issues will battle in Congress as the Federal Government engages in a fresh drive to curb deforestation. Brazil boasts the greatest carbon sequestration potential in the world through reforestation and afforestation thanks to its vast sun-bathed tropical territory. Brazil may have a large amount of carbon credits to trade as the regulated global carbon market envisaged in the COP 26 finds its stride. Taking advantage of this opportunity requires creating a domestic regulated carbon market and the prospects for that will be favorable in a Lula administration.
Given the differences in their emissions profiles and in their domestic policy and foreign policy positions, the BRICS group is not a consistent coalition in international climate policy. Understanding this is important both to form a clear picture of real conditions for global decarbonization progress and propose a research agenda on the issue.
[1] Comparison with G20 countries is more accurate because small oil exporting countries show high per capita emissions and Gross Domestic Product (GDP) GHG intensity but their social and economic structure is very different from that of BRICS countries.
[2] Our calculations are based on Greenhouse Gas Emissions and Removals Estimates (SEEG 2022) data for Brazil and on Climate Watch Data (2022) data for other countries.
[3] China's weight is such that its energy sector alone accounted for 20.51% of total global emissions in 2019.
[4] Constant international 2017 dollars, PPP; 2014 data, the latest available from the World Bank. China's per capita energy intensity is much lower: 2.2 tonnes of oil equivalent versus the 4-tonne 2014 OECD average.
[5] According to the 2014-2020 Strategic Energy Development Action Plan.
[6] Constant international 2017 dollars, PPP; 2014 data, the latest available from the World Bank.
[7] Our calculations are based on IEA, World Energy Outlook 2021 (SDG 7 database) and The World Bank data.
[8] Carbon Tax Act 15.
[9] The program offered Brazilian Development Bank (BNDES) funding, twenty-year contracts at favorable prices and a feed-in rate, in addition to participation in specific auctions.
[10] Countries in the climate regime periodically publish National Emissions Inventories calculating each country's total and sectoral emissions. Those publications serve as a basis to assess the ambition of emissions reduction commitments. Emissions calculation methods are reviewed from time to time to incorporate measurement and calculation improvements. Policy commitments are expected to be reviewed when that occurs but the collective emissions reduction target must remain constant and will be achieved only if all countries from time to time increase their ambitions.
[11] Early on during the pandemic, discussions about the virus’s origin and China's withholding in the initial weeks of information that, had it been published, could have helped contain the epidemic, as happened with the 2003 SARS outbreak, fueled animosity between China and the United States.
References
Boese, Vanessa A. et al. 2022. Autocratization Changing Nature? Democracy Report 2022. Varieties of Democracy Institute (V-Dem), University of Gothenburg. https://v-dem.net/media/publications/dr_2022.pdf.
Brazil. 2002. Lei n.º 10.438/2002. Programa de Incentivo às Fontes Alternativas de Energia Elétrica (PROINFA). http://www.planalto.gov.br/ccivil_03/leis/2002/l10438.htm.
Brazil. 2008. Plano Nacional sobre Mudança do Clima. Comitê Interministerial sobre Mudança do Clima. https://www.terrabrasilis.org.br/ecotecadigital/pdf/plano-nacional-sobre-mudanca-do-clima-brasil-pnmc.pdf.
Brazil. 2009. Lei n.º 12.187/2009 (Política Nacional de Mudanças Climáticas). http://www.planalto.gov.br/ccivil_03/_ato2007-2010/2009/lei/l12187.htm.
Brazil. 2010. Comunicação da República Federativa do Brasil à UNFCCC de seu compromisso voluntário de redução de emissões no âmbito do Acordo de Copenhague. United Nations Framework Convention on Climate Change. https://unfccc.int/files/meetings/cop_15/copenhagen_accord/application/pdf/brazilcphaccord_app2.pdf.
Brazil. 2015. NDC brasileira. Nationally Determined Contributions Registry, United Nations Climate Change. https://unfccc.int/NDCREG.
Brazil. 2020. NDC brasileira, primeira atualização. Nationally Determined Contributions Registry, United Nations Climate Change. https://unfccc.int/NDCREG.
Brazil. 2022. NDC brasileira, segunda atualização. Nationally Determined Contributions Registry, United Nations Climate Change. https://unfccc.int/NDCREG.
China. 2007. Energy Conservation Act. Grantham Research Institute on Climate Change and the Environment, London School of Economics and Political Science. https://www.climate-laws.org/geographies/china.
China. 2008. Regulation 530/2008 on Energy Conservation in Buildings of Civil Usage. Grantham Research Institute on Climate Change and the Environment, London School of Economics and Political Science. https://www.climate-laws.org/geographies/china.
China. 2009. Renewable Energy Act (revision of the 2006 law). Grantham Research Institute on Climate Change and the Environment, London School of Economics and Political Science. https://www.climate-laws.org/geographies/china.
China. 2011. 12th Five-Year Plan for the Development of National Economy and Society (2011-2015). Grantham Research Institute on Climate Change and the Environment, London School of Economics and Political Science. https://www.climate-laws.org/geographies/china.
China. 2014a. Energy Development Strategy Action Plan (2014-2020). Grantham Research Institute on Climate Change and the Environment, London School of Economics and Political Science. https://www.climate-laws.org/geographies/china.
China. 2014b. National Plan for Tackling Climate Change 2014-2020. Grantham Research Institute on Climate Change and the Environment, London School of Economics and Political Science. https://www.climate-laws.org/geographies/china.
China. 2015. China’s NDC. Nationally Determined Contributions Registry, United Nations Climate Change. https://unfccc.int/NDCREG.
China. 2016. National Innovation-Driven Development Strategy Outline. Grantham Research Institute on Climate Change and the Environment, London School of Economics and Political Science. https://www.climate-laws.org/geographies/china.
China. 2018. Electric Power Law (revision of 1995 law). Grantham Research Institute on Climate Change and the Environment, London School of Economics and Political Science. https://www.climate-laws.org/geographies/china.
China. 2020. New Energy Vehicle Industry Development Plan and 2020 New Energy Vehicle Promotion Subsidy Plan. Grantham Research Institute on Climate Change and the Environment, London School of Economics and Political Science. https://www.climate-laws.org/geographies/china.
China. 2021a. 14th Five-Year Plan for the Development of National Economy and Society (2021-2025). Grantham Research Institute on Climate Change and the Environment, London School of Economics and Political Science. https://www.climate-laws.org/geographies/china.
China. 2021b. Action Plan for Carbon Dioxide Peaking before 2030 (‘1+N’). Grantham Research Institute on Climate Change and the Environment, London School of Economics and Political Science. https://www.climate-laws.org/geographies/china.
China. 2021c. 14th Five-Year Comprehensive Work Plan for Energy Saving and Emission Reduction 2021-2025 (Notice 33). Grantham Research Institute on Climate Change and the Environment, London School of Economics and Political Science. https://www.climate-laws.org/geographies/china.
China. 2021d. China’s NDC First Update. Nationally Determined Contributions Registry, United Nations Climate Change. https://unfccc.int/NDCREG.
China. 2022a. 14th Five-Year Plan on Modern Energy System Planning. Grantham Research Institute on Climate Change and the Environment, London School of Economics and Political Science. https://www.climate-laws.org/geographies/china.
China. 2022b. Plan on Reaching Peak CO2 Emissions by 2030 in Polluting Industries. Grantham Research Institute on Climate Change and the Environment, London School of Economics and Political Science. https://www.climate-laws.org/geographies/china.
Climate Action Tracker. 2022. India Climate Commitment Profile. https://climateactiontracker.org/countries/india/.
Climate Watch Data. 2022. Historical Emissions. World Resources Institute. https://www.climatewatchdata.org/ghg-emissions.
Crespo, Samira & Pedro Leitão. 1993. O que o brasileiro pensa da ecologia? Rio de Janeiro: Gráfica Ebal - Editora Brasil América Ltda. https://www.iser.org.br/publicacao/outros/o-que-o-brasileiro-pensa-da-ecologia-1993/.
EPE. 2022. Balanço energético nacional, séries históricas 1970-2021. Empresa de Pesquisa Energética. https://www.epe.gov.br/pt/publicacoes-dados-abertos/publicacoes/BEN-Series-Historicas-Completas.
Evans, Simon. 2021. “Which Countries are Historically Responsible for Climate Change?” Carbon Brief, October 5, 2021. https://www.carbonbrief.org/analysis-which-countries-are-historically-responsible-for-climate-change/.
Fan, C. Cindy. 2006. “China’s Eleventh Five-Year Plan (2006–2010): from ‘Getting Rich First’ to ‘Common Prosperity’.” Eurasian Geography and Economics 47 (6): 708–723. https://doi.org/10.2747/1538-7216.47.6.708.
Harari, Yuval Noah. 2018. 21 Lessons for the 21st Century. London: Random House.
IEA. 2021. 2021 Key World Energy Statistics. Report. International Energy Agency. https://www.iea.org/reports/key-world-energy-statistics-2021.
IEA. 2022a. Country Profile: South Africa. International Energy Agency. https://www.iea.org/countries/south-africa.
IEA. 2022b. “Global coal demand is set to return to its all-time high in 2022.” International Energy Agency, July 28, 2022. https://www.iea.org/news/global-coal-demand-is-set-to-return-to-its-all-time-high-in-2022.
India. 2007. 11th Five Year Plan. Grantham Research Institute on Climate Change and the Environment, London School of Economics and Political Science. https://www.climate-laws.org/geographies/india.
India. 2008. National Action Plan on Climate Change. Grantham Research Institute on Climate Change and the Environment, London School of Economics and Political Science. https://www.climate-laws.org/geographies/india.
India. 2009. National Policy on Biofuels. Grantham Research Institute on Climate Change and the Environment, London School of Economics and Political Science. https://www.climate-laws.org/geographies/india.
India. 2013. 12th Five Year Plan (2012–2017): faster, more inclusive and sustainable growth. The Asia and Pacific Energy Forum. https://policy.asiapacificenergy.org/node/2511.
India. 2014. National Auto Fuel Policy and Auto Fuel Vision and Policy 2025. Grantham Research Institute on Climate Change and the Environment, London School of Economics and Political Science. https://www.climate-laws.org/geographies/india.
India. 2015. India’s NDC. Nationally Determined Contributions Registry, United Nations Climate Change. https://unfccc.int/NDCREG.
India. 2016. Tariff Policy 2006 (revision). Grantham Research Institute on Climate Change and the Environment, London School of Economics and Political Science. https://www.climate-laws.org/geographies/india.
India. 2021. India’s NDC, First Update. Nationally Determined Contributions Registry, United Nations Climate Change. https://unfccc.int/NDCREG.
Liang, Boyi et al. 2022. “Planted Forest is Catching up with Natural Forest in China in Terms of Carbon Density and Carbon Storage.” Fundamental Research 2 (5): 688-696. https://doi.org/10.1016/j.fmre.2022.04.008.
MapBiomas. 2022. Taxas de desmatamento Amazônia e Cerrado. Projeto MapBiomas – Coleção 7 da Série Anual de Mapas de Uso e Cobertura da Terra do Brasil. https://plataforma.brasil.mapbiomas.org/.
MCTI. 2016. Estimativas anuais de emissões de gases de efeito estufa no Brasil. Third Edition. Report. Ministério da Ciência, Tecnologia, Inovações e Comunicações. https://www.gov.br/mcti/pt-br/acompanhe-o-mcti/sirene/publicacoes/estimativas-anuais-de-emissoes-gee/arquivos/estimativas_3ed.pdf.
NOAA. 2022. Trends in Atmospheric Carbon Dioxide. Global Monitoring Laboratory, National Oceanic and Atmospheric Administration. https://gml.noaa.gov/ccgg/trends/.
Rosen, Daniel H. & Trevor Houser. 2007. China Energy: a Guide for the Perplexed. Center for Strategic and International Studies & Peterson Institute for International Economics. https://www.cebc.org.br/sites/default/files/apresentacao_trevor_house.pdf.
Russia 2009. Climate Doctrine of Russia. Grantham Research Institute on Climate Change and the Environment, London School of Economics and Political Science. https://www.climate-laws.org/geographies/russia.
Russia 2013. Decree No. 449 on the Mechanism for the Promotion of Renewable Energy on the Wholesale Electricity and Market. Grantham Research Institute on Climate Change and the Environment, London School of Economics and Political Science. https://www.climate-laws.org/geographies/russia.
Russia 2014. State Program on Energy Efficiency and Energy Development (approved by Government Decree No 321). Grantham Research Institute on Climate Change and the Environment, London School of Economics and Political Science. https://www.climate-laws.org/geographies/russia.
Russia 2015. Russia’s NDC. Nationally Determined Contributions Registry, United Nations Climate Change. https://unfccc.int/NDCREG.
Russia 2019. Decree 216/2019 Approving the Energy Security Doctrine. Grantham Research Institute on Climate Change and the Environment, London School of Economics and Political Science. https://www.climate-laws.org/geographies/russia.
Russia 2020. Russia’s NDC, First Update. Nationally Determined Contributions Registry, United Nations Climate Change. https://unfccc.int/NDCREG.
Russia 2021. Presidential Decree 400/2021 on the National Security Strategy of the Russian Federation. Grantham Research Institute on Climate Change and the Environment, London School of Economics and Political Science. https://www.climate-laws.org/geographies/russia.
Ryan, Daniel. 2017. “Politics and Climate Change: Exploring the Relationship between Political Parties and Climate Issues in Latin America.” Ambiente & Sociedade 20 (3): 271-286. https://doi.org/10.1590/1809-4422ASOCEx0007V2032017.
SEEG. 2022. Emissões brasileiras [database]. Sistema de Estimativas de Emissões e Remoções de Gases de Efeito Estufa, Observatório do Clima. https://plataforma.seeg.eco.br/total_emission.
South Africa. 2010. Comunicação da República da África do Sul à UNFCCC de seu compromisso voluntário de redução de emissões no âmbito do Acordo de Copenhague. Department of Environmental Affairs. https://unfccc.int/files/meetings/cop_15/copenhagen_accord/application/pdf/southafricacphaccord_app2.pdf.
South Africa. 2011. National Climate Change Response Policy White Paper (NCCRP). Grantham Research Institute on Climate Change and the Environment, London School of Economics and Political Science. https://www.climate-laws.org/geographies/south-africa.
South Africa. 2015. South Africa’s NDC. Nationally Determined Contributions Registry, United Nations Climate Change. https://unfccc.int/NDCREG.
South Africa. 2017. National Greenhouse Gas Emissions Reporting Regulations, 2016. Grantham Research Institute on Climate Change and the Environment, London School of Economics and Political Science. https://www.climate-laws.org/geographies/south-africa.
South Africa. 2018. Green Transport Strategy 2018-2050. Grantham Research Institute on Climate Change and the Environment, London School of Economics and Political Science. https://www.climate-laws.org/geographies/south-africa.
South Africa. 2019a. Carbon Tax Act 15. Grantham Research Institute on Climate Change and the Environment, London School of Economics and Political Science. https://www.climate-laws.org/geographies/south-africa.
South Africa. 2019b. National Energy Efficiency Strategy. Grantham Research Institute on Climate Change and the Environment, London School of Economics and Political Science. https://www.climate-laws.org/geographies/south-africa.
South Africa. 2019c. Integrated Resources Plan. Grantham Research Institute on Climate Change and the Environment, London School of Economics and Political Science. https://www.climate-laws.org/geographies/south-africa.
The World Bank. 2022. World Development Indicators, indicator EG.USE.COMM.GD.PP.KD. IEA Statistics. International Energy Agency, Organisation for Economic Co-operation and Development (OECD). https://data.worldbank.org/indicator/EG.USE.COMM.GD.PP.KD.
Tong, Xiaowei et al. 2020. “Forest Management in Southern China Generates Short Term Extensive Carbon Sequestration.” Nature Communications 11, 129. https://doi.org/10.1038/s41467-019-13798-8.
UN News. 2021. “Russia will achieve carbon neutrality by 2060.” Climate and environment, UN News, October 14, 2021. https://news.un.org/ru/story/2021/10/1411842.
Unterstell, Natalie & Nathália Martins. 2022. NDC do Brasil: Avaliação da atualização submetida à UNFCCC em 2022. Nota Técnica. Rio de Janeiro: TALANOA. https://www.politicaporinteiro.org/wp-content/uploads/2022/04/Analise-NDC-022_V0.pdf.
Viola, Eduardo & Matías Franchini. 2018. Brazil and Climate Change: Beyond the Amazon. New York: Routledge.
Viola, Eduardo, Matias Franchini & Thais Lemos Ribeiro. 2013. Sistema internacional de hegemonia conservadora – governança global e democracia na era da crise climática. São Paulo: Annablume.
Zhang, Lei et al. 2021. “Where Should China Practice Forestry in a Warming World?” Global Change Biology 28 (7): 2461-2475. https://doi.org/10.1111/gcb.16065.
Submitted: November 13, 2022
Accepted for publication: November 17, 2022
Copyright © 2023 CEBRI-Journal. This is an Open Access article distributed under the terms of the Creative Commons Attribution License, which permits unrestricted use, distribution, and reproduction in any medium, provided the original article is properly cited.
